Back to all services 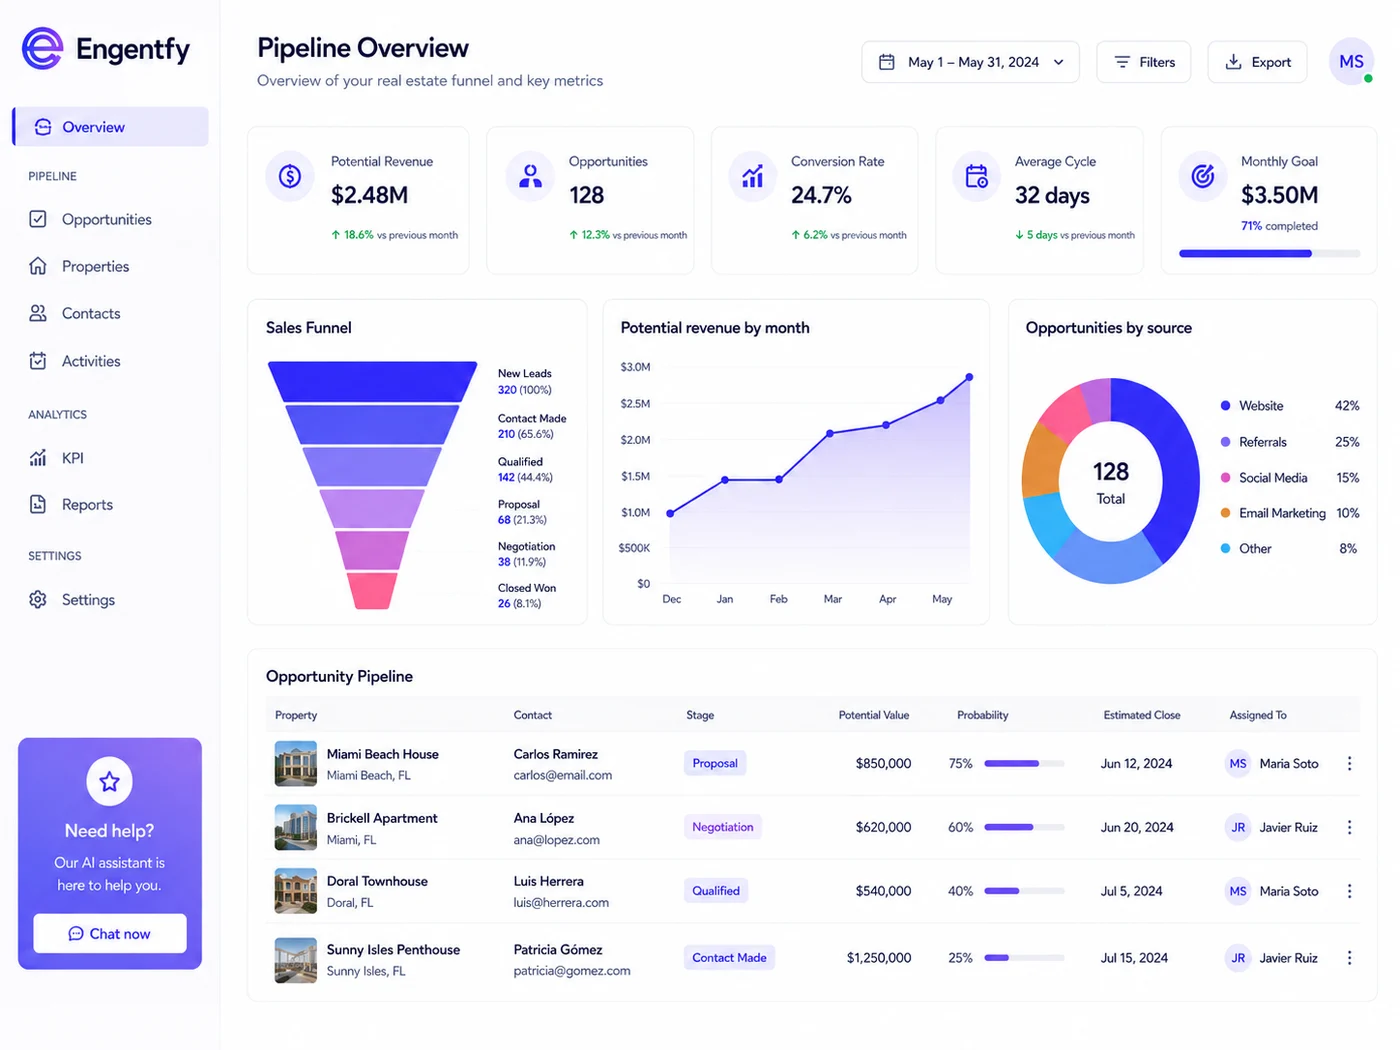
Internal Dashboards
Real estate pipeline & KPI board
The numbers a broker actually checks — deals, GCI, and forecast — without the spreadsheet wrangling.
★ Featured
Overview
Brokerage KPIs usually mean someone exports three reports and rebuilds a spreadsheet every week. This board does it automatically: deals under contract, projected GCI, close rate, average days on market, and per-agent production. It updates itself, so the weekly review takes five minutes instead of an afternoon.
What's included
- Deals, volume, and GCI tracked from contract to close
- Forecast view based on your current pipeline
- Per-agent production leaderboard
- Trend charts for close rate and days on market
- Auto-refresh — no manual exports or rebuilds
Tools we use
- Retool
- Bubble
- Supabase